Why low-code is transforming data analytics in IIoT
More than 65% of application development will be in low-code by 2024. In today's rapidly evolving technological landscape, low-code development has emerged as a powerful tool for simplifying software development processes.
With its ability to reduce the need for extensive coding expertise, low-code development enables faster application creation and deployment. In particular, when applied to data analytics in Industrial Internet of Things (IIoT) systems, low-code offers numerous benefits and empowers users to extract valuable insights from vast amounts of data.
This article explores the advantages of low-code for data analytics in IIoT, highlighting its cost-effectiveness, increased flexibility, speed, and collaboration capabilities.
Table of Contents
What is Low-Code Development?
Low-code development refers to an approach that enables users to build software applications with minimal hand-coding. It leverages visual interfaces, pre-built components, and drag-and-drop functionality to simplify the application development process.
By abstracting away complex code implementation, low-code data platforms allow users with varying levels of technical expertise to create applications efficiently.

Benefits of Low-Code for Data Analytics
Low code analytics enables non-technical users to create and customize analytics applications without extensive coding knowledge. It uses visual interfaces, drag-and-drop features, and pre-built components for designing dashboards, reports, and data visualizations.
This approach accelerates development, reduces reliance on IT, and allows quick access to data for informed decision-making.
1. Cost-effectiveness
Low-code development offers cost advantages for organizations by reducing the resources required for software development.
Here's how it contributes to cost-effectiveness in data analytics:
Reduced development effort: Low-code platforms provide pre-built components and libraries specifically designed for data analytics tasks. This eliminates the need for extensive coding from scratch, significantly reducing development time and effort.
Enhanced productivity: With a simplified development process, low-code empowers non-technical users, such as data analysts and domain experts, to directly participate in the analytics application development. This reduces the dependency on dedicated software development teams, leading to improved productivity.
2. Increased Flexibility
Low-code development ensures flexibility in data analytics applications by offering customizable solutions.
Here's how it enables flexibility in IIoT systems:
Modularity and reusability: Low-code platforms typically support modular design principles, allowing users to break down complex analytics processes into smaller, manageable blocks. These blocks can be reused across multiple projects, promoting code reusability and reducing redundancy.
Easy integration: Low-code platforms often provide seamless integration capabilities, enabling users to connect data sources, APIs, and other software components effortlessly. This allows for a flexible and agile data analytics ecosystem, where new data sources and technologies can be easily incorporated.
3. Speed / Faster Time-to-Market
Low-code development significantly accelerates the time-to-market for data analytics applications.
Here's how it expedites the development process:
Here's how it expedites the development process:
Rapid prototyping: Low-code platforms facilitate quick prototyping and iterative development cycles. Users can quickly create functional prototypes and gather feedback, reducing the time spent on traditional coding and debugging.
Visual interface: The visual nature of low-code development allows users to visualize the entire data processing flow and make changes in near-real time. This promotes faster decision-making and adjustments, ultimately speeding up the development process.
4. Greater Collaboration
Low-code development encourages collaboration between various stakeholders involved in data analytics projects.
Here's how it enhances collaboration:
Here's how it enhances collaboration:
Cross-functional collaboration: Low-code platforms provide a common interface that enables collaboration between data analysts, domain experts, and software developers. By bringing together diverse perspectives, low-code promotes effective teamwork and enhances the quality of analytics solutions.
User-friendly interface: With its intuitive visual interface, low-code platforms foster communication between technical and non-technical team members. This facilitates a shared understanding of the analytics process and promotes collaborative problem-solving.
The following diagram illustrates functional block programming in an IIoT use case. Say an edge gateway acquires raw data from multiple sensor sources.
It then down samples and averages the raw noisy data over a time window. After that, it formats the data, adds metadata, and sets the alert threshold.
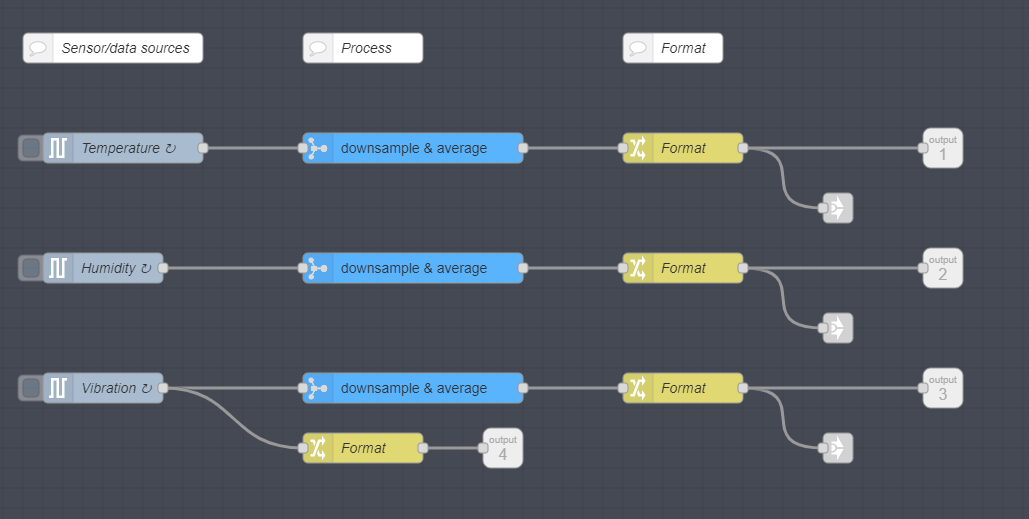
In this example application, the user will be trying to answer the following questions:
What’s the property of the raw sensor data?
What’s the optimal sampling window?
What’s the optimal data filter - algebraic, RMS, frequency-based, or something else?
What’s the optimal alert threshold? Does it shift over time?
Note that none of these questions have anything to do with coding or coding skills.
Instead, they require the user to work with the data at different stages of the processing path, to visualize data at different nodes, compare raw data with filtered data, experiment with alert threshold, etc.
The user may also want to work with simulated data sources before applying it to real hardware.
Data analytics software is designed to help users to work on data. It organizes data processing in a visual, modular, and hierarchical flow. The user can easily visualize the entire data processing path in near-real time.
She can tap in at any node to visualize the data, adjust the algorithms, and move the processing steps around. The key is simplicity and flexibility.

Prescient Designer, Prescient Devices’ distributed low-code edge solutions software, further helps users to optimize data analytics at the edge and in the cloud. It unifies the edge and the cloud by representing them as functional blocks in the same functional block programming diagram.
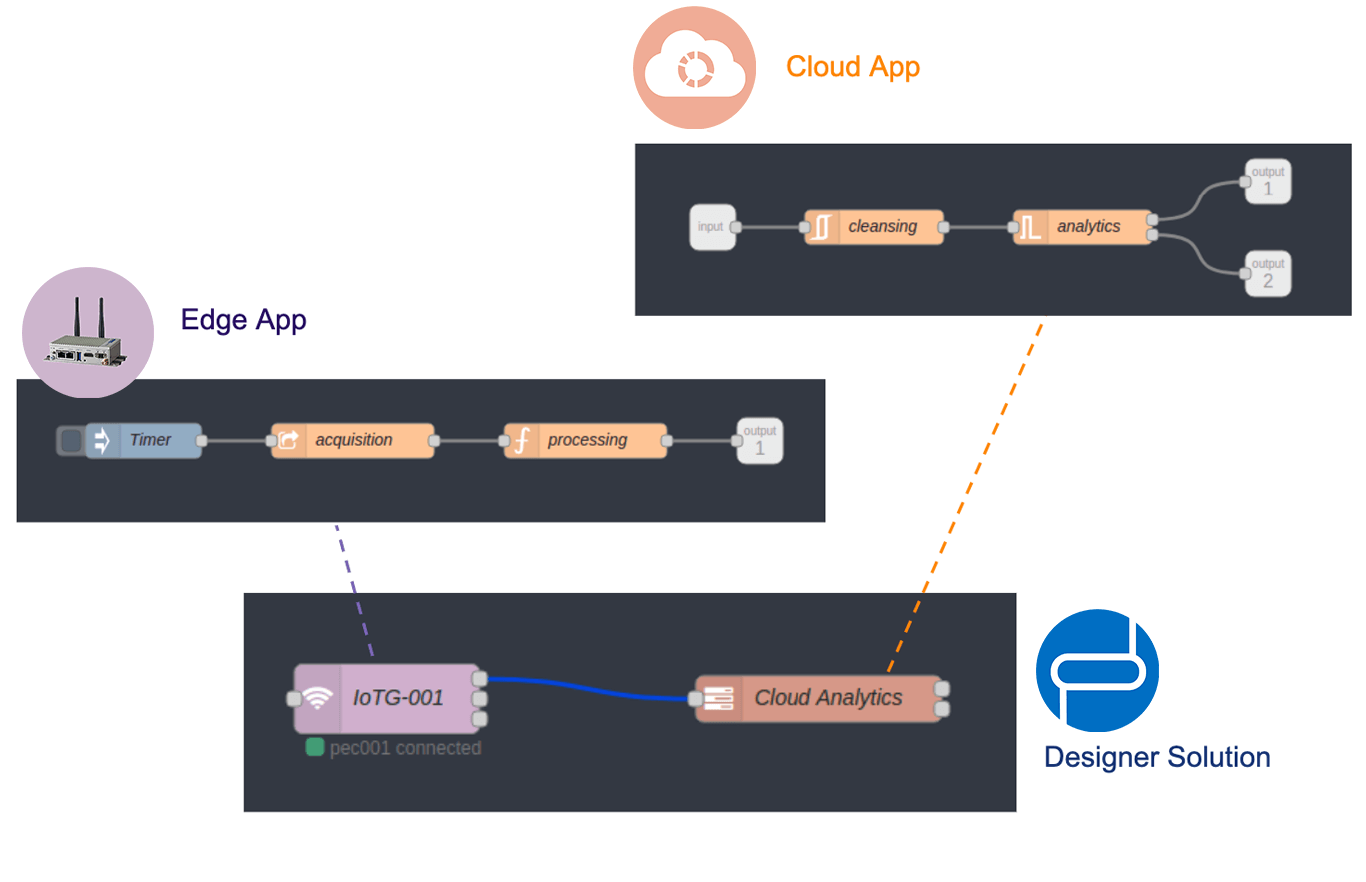
As illustrated in the above figure, the “IoTG-001” block represents data processing at the edge, and it can be associated with and deployed to thousands of edge devices.
The “Cloud Analytics” block receives data from the edge devices and performs further data processing in the cloud. So users often need to answer the following question: how to optimize the processing at the edge vs. in the cloud?
In Prescient Designer, any functional block can be moved between the edge and the cloud. For example, if the user wants to see the effect of cleansing the data at the edge instead of in the cloud, she would simply cut the “cleansing” block from “Cloud Analytics” and paste it into the “IoTG-001” block.
When there are thousands of edge devices in the system, this could significantly reduce the workload in the cloud. The key again is simplicity and flexibility -- when users can easily perform optimization experiments, they are more likely to produce better solutions.
IIoT software development systems are more about working with data than business logic. Low-code data analytics enables users to build data faster and gain deeper insights, and it cuts 50% to 90% of development effort.
At 50% better efficiency, an organization would build an 8x competitive advantage in 3 years. As an offensive or defensive strategy, every organization should consider the potential impact of low-code to its business.
Conclusion:
In conclusion, Prescient Designer, the distributed low-code data analytics solution offered by Prescient Devices, is a game-changer for data analytics in Industrial Internet of Things (IIoT) systems. By leveraging the power of low-code development,
Prescient Designer simplifies the application development process, allowing users to build data analytics solutions faster and more efficiently. The cost-effectiveness of low-code is evident through reduced development effort and enhanced productivity, enabling organizations to extract valuable insights from data without the need for extensive coding expertise.
Ready to experience the benefits of low-code for data analytics in IIoT systems? Try Prescient Designer now and unlock the potential of your organization's data.